

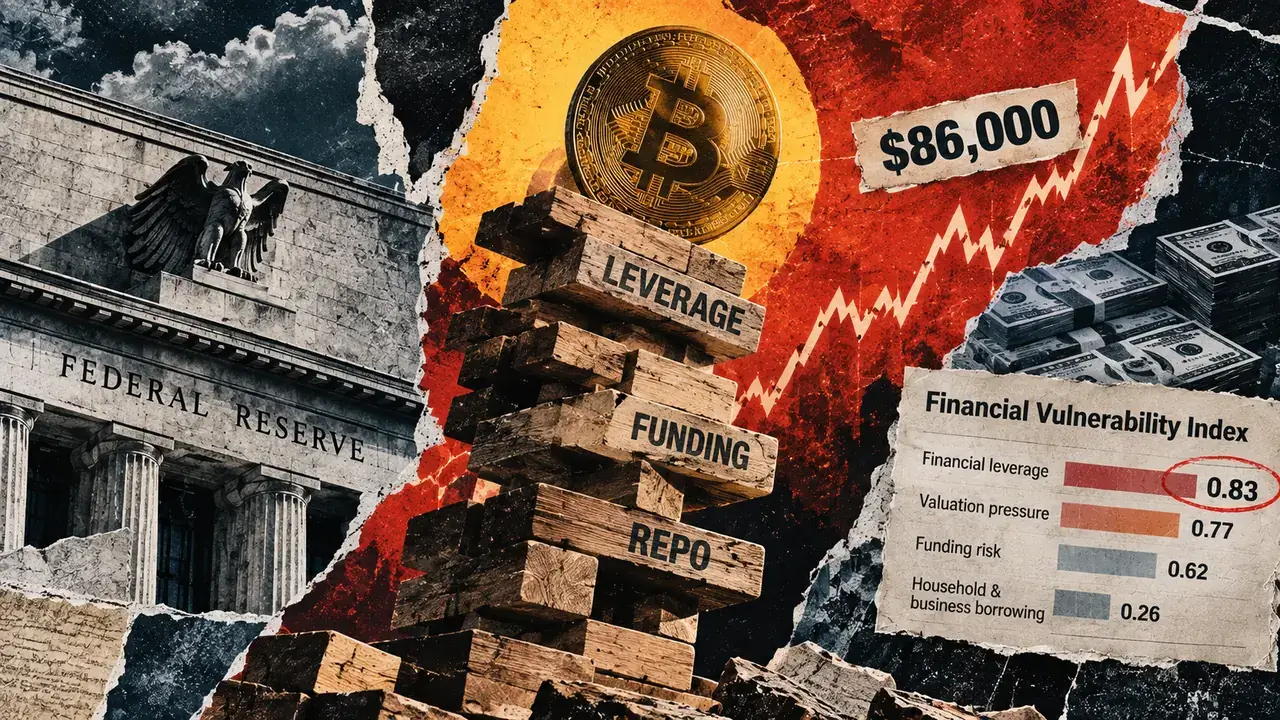
Bitcoin’s rally and the Federal Reserve’s new financial-risk gauge describe two different time horizons. BTC reflects demand and positioning in today’s market. The Fed’s measure tracks structural weaknesses that could magnify the next shock.
The Financial Vulnerability Index is built to capture slow-moving vulnerability rather than coincident market stress. In Figure 2, the final financial-leverage annotation is 0.83, inside the “elevated” band of its historical distribution. The aggregate index is labeled 0.65, valuation pressure 0.77 and funding risk 0.62, all “notable.” Household and business borrowing is lower at 0.26.
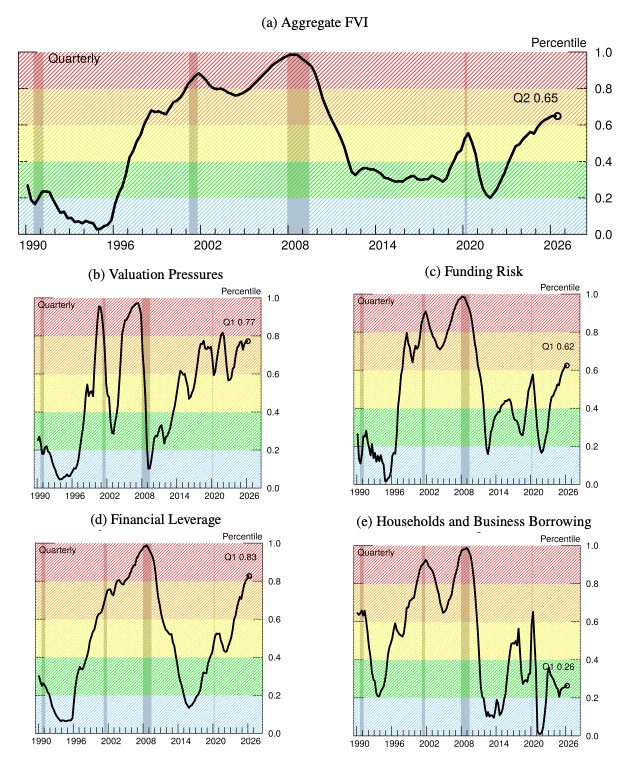
The chart labels the four components Q1 and the aggregate index Q2, with 2026 as the last axis mark. The working paper separately says its dataset and several estimation samples end in 2025:Q4, without explaining whether the endpoints are later-vintage observations, nowcasts or a labeling issue. That limits the safe description to Figure 2’s quarter labels and values, without assigning them a verified 2026 observation date.
The distinction between vulnerability and current conditions explains the apparent split. Conventional financial-conditions indexes rise as credit tightens and visible stress emerges. The FVI can build through calmer periods as leverage and risk-taking accumulate.
Bitcoin’s current move has its own drivers. On Sept. 21 BTC touched $86,000, more than 10% above the prior Sunday close, as spot taker flow turned positive and volume rose. Short liquidations helped Monday’s leg higher. Futures open interest and funding paid by longs were above Glassnode’s high bands, options open interest was near $41 billion, and options were pricing less movement than the market delivered.
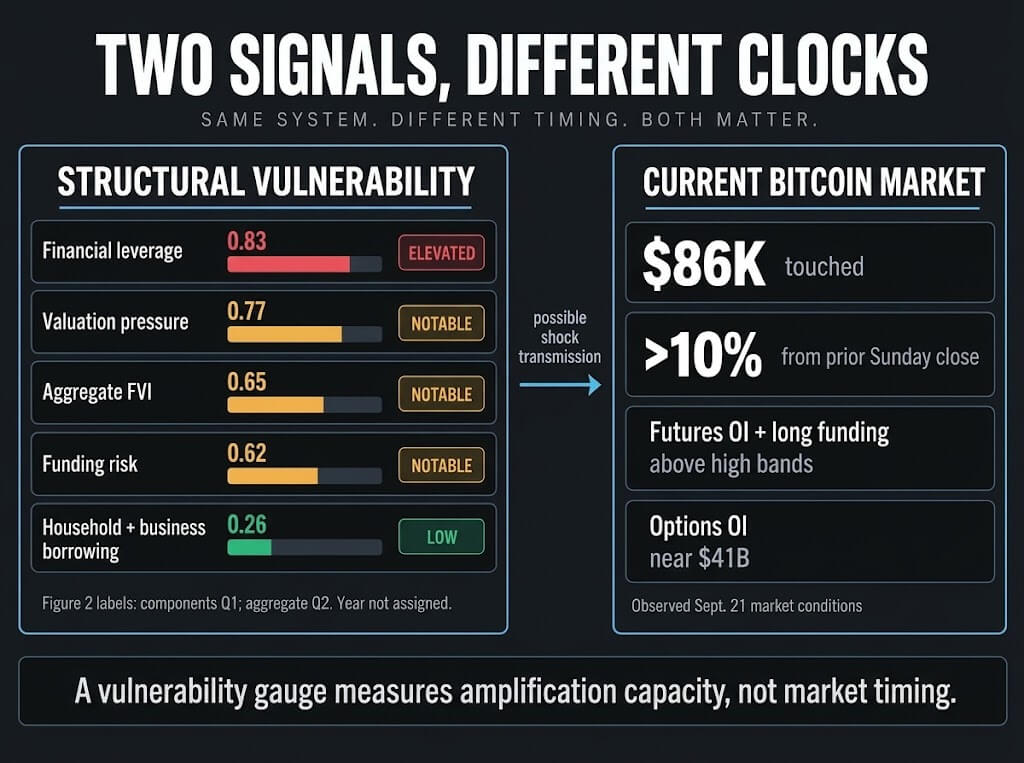
How funding stress could reach Bitcoin
A June analysis, “Decomposing Hedge Funds’ U.S. Treasury Exposures,” estimated that large hedge funds had $4 trillion of gross Treasury exposure and $3 trillion of repo borrowing as of September 2025. Its proxy estimates included about $830 billion in cash-futures basis trades and $305 billion in swap-spread trades.
The Fed’s separate review of government bond-backed repo markets found that short-term funding, dealer intermediation, collateral reuse and low haircuts can carry stress across funding, cash and derivatives markets. Higher margin calls or tighter dealer capacity could force liquid-asset sales, weaken crypto spot demand and liquidate leveraged BTC positions. That cross-market sequence remains a scenario; the cited evidence has not observed the full chain.
The working paper’s historical model shows why the vulnerability reading matters. In high-FVI periods, the same modeled business-cycle shock produced deeper declines in consumption and long-term investment than in low-FVI periods. The index is therefore best read as an amplifier gauge: it describes the system’s capacity to turn a shock into wider damage, while Bitcoin’s immediate path remains tied to flows, liquidity and positioning.
The working paper reflects its authors’ analysis and does not indicate concurrence by the Federal Reserve Board.
