
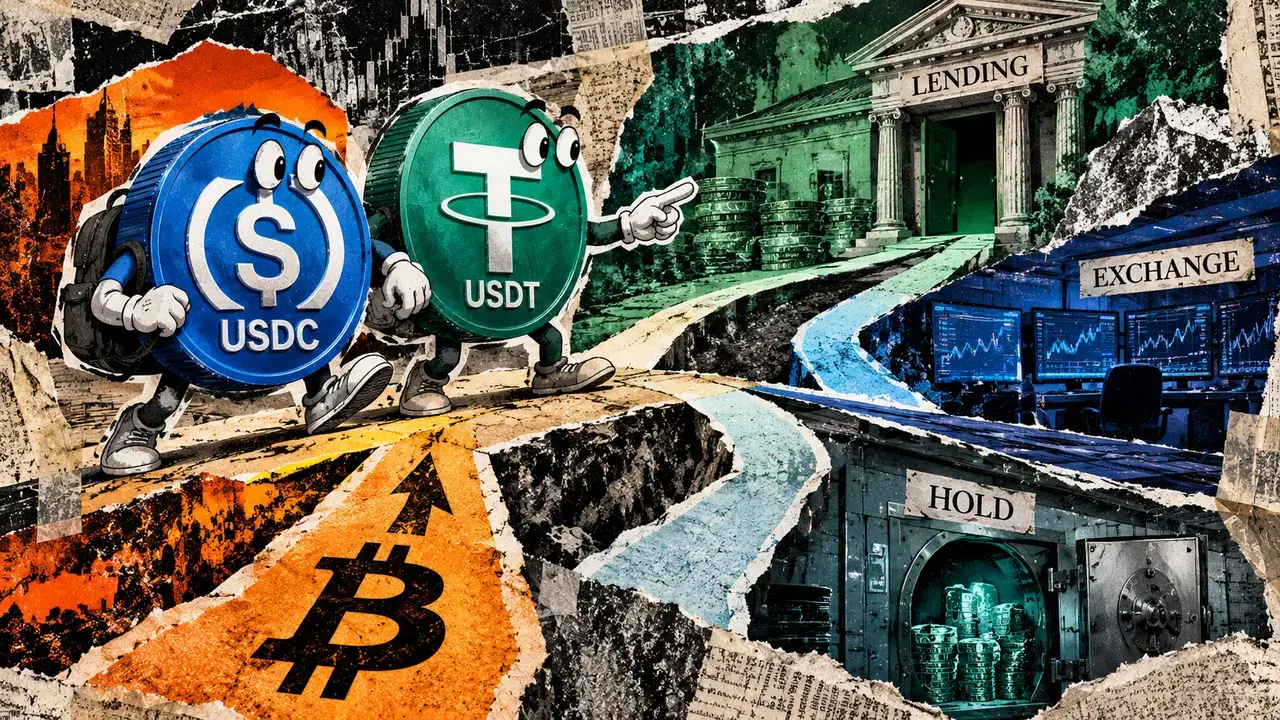
USDC and USDT supply can grow to meet different kinds of demand for dollar stablecoins, according to Coin Metrics research published Oct. 20. For Bitcoin investors, that complicates treating their combined issuance as a single pool of cash waiting to buy BTC.
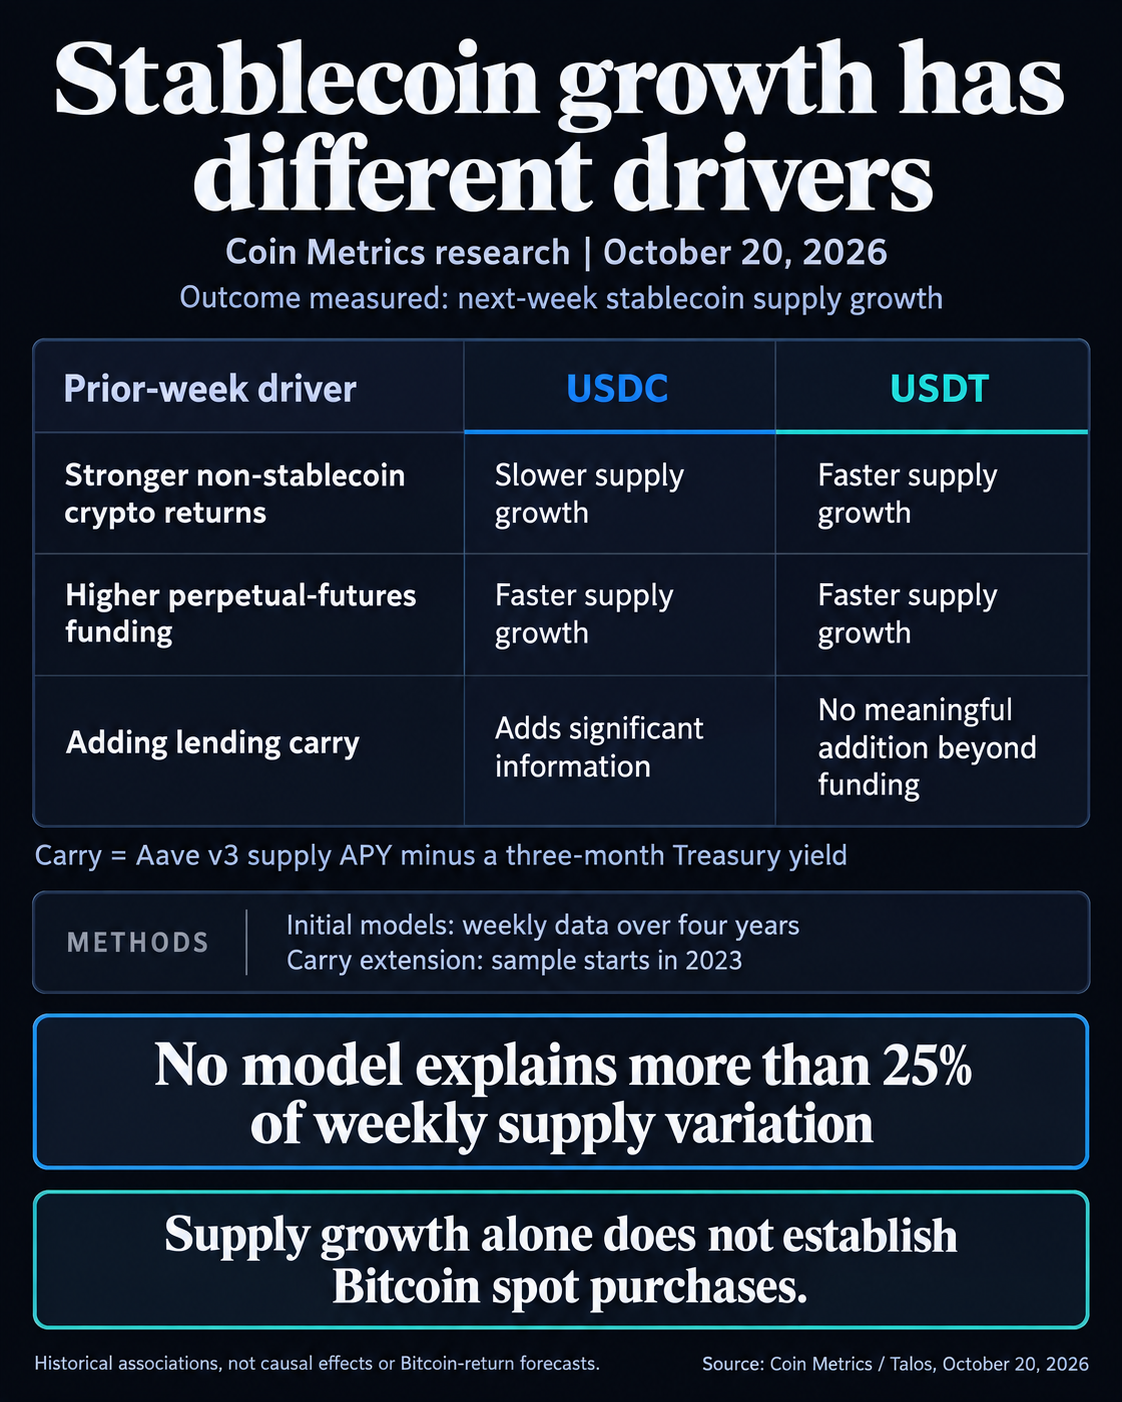
The study associates stronger non-stablecoin crypto-market returns with slower USDC growth the following week and faster USDT growth. It also finds a lending-yield association specific to USDC. Those differences matter because a new dollar token can serve a borrower, a lender or someone staying in dollars before it ever reaches a Bitcoin trade.
Aggregate stablecoin supply measures tokens outstanding. The new findings give Bitcoin investors a reason to examine what those balances are doing before interpreting issuance as fresh spot-buying demand.
What USDC and USDT regressions show
The opposing return relationships show why issuer composition matters. Coin Metrics’ study uses weekly observations over four years, testing six drivers from the previous week against subsequent supply growth. Higher perpetual-futures funding rates associate with faster growth for both issuers, accounting for about 10% of USDC’s weekly supply-growth variation and 4% of USDT’s after controls.
A separate analysis starting in 2023 uses the gap between lending protocol Aave v3’s annual percentage yield, or APY, and a three-month Treasury yield. This carry spread adds significant explanatory information for USDC, but no meaningful increment for USDT or combined supply beyond funding.
The lagged issuer models account for about 13% of USDC’s weekly ups and downs in supply growth and 16% of USDT’s. None of the study’s models accounts for more than 25%, leaving most movement unexplained. Those historical associations do not establish causation or test future Bitcoin returns.
A positive relationship for one issuer and a negative one for another can coexist inside the same total.
Collateral demand is especially relevant to the inference. A trader needing dollar-denominated collateral and an investor choosing to hold dollar balances can both contribute to demand for stablecoins. The same aggregate reading can therefore sit alongside different investor intentions.
Where new stablecoins can go
Circle’s description of USDC minting starts with a customer depositing dollars and receiving newly issued tokens. Redemption takes tokens out of circulation.
Tether describes uses that include payments and exiting market positions. A holder retaining stablecoins after reducing risk has made a different decision from one buying Bitcoin, even if both need the same dollar token.
Lending creates another destination. Aave explains that supplied assets enter liquidity pools, earn interest and can serve as collateral.
Existing tokens can also move between holders without new issuance, separating growth in circulation from trading activity.
That distinction also applies to exchange reserves. CryptoSlate’s July 20 analysis used stablecoin balances at Binance and Bybit to assess liquidity available for Bitcoin purchases. Those venue balances are closer to a trading location than total circulation, but an exchange deposit is still an intermediate step, not a completed purchase.
Aave rates show why the timestamp matters
Aavescan’s Ethereum v3 USDC and USDT dashboards show how quoted supply annual percentage rates (APRs) vary between live readings and daily snapshots. The historical comparison below uses midnight UTC observations from Oct. 19.
The Aave quotes can be set beside FRED’s Treasury observation for the same calendar date:
| Market or benchmark | Annualized quote | Quotation basis |
|---|---|---|
| Aave v3 Ethereum USDC | 11.5% | Supply APR, midnight UTC |
| Aave v3 Ethereum USDT | 3.1% | Supply APR, midnight UTC |
| Three-month Treasury constant maturity | 4.27% | DGS3MO, investment basis |
The Aave rows exclude historical incentives. The Treasury entry is the DGS3MO investment-basis series, distinct from DTB3’s 4.1% discount-basis quote. It is a different benchmark, not a direct conversion of the same bill observation.
TreasuryDirect defines investment yield as annualized simple interest without compounding. This puts the comparison alongside Aave’s quoted APR without adding compounding to either side. Matching dates still does not synchronize observations, match holding periods or reproduce the study’s historical APY-based carry calculation.
USDC’s 11.5% midnight snapshot is a point-in-time quote. Aavescan’s methodology explains that snapshots can miss intraday changes; interest-index growth measures accrual over an interval.
A yield comparison also leaves the underlying risks intact. Aave documents smart-contract, oracle, collateral and network risks.
The combined USDC and USDT figure describes potential dollar liquidity with several possible jobs. Connecting issuance to destination and execution is what would show how much of it is becoming a Bitcoin bid.
