

Bitcoin (BTC) approached $82,000 on Wednesday as South Korea’s KOSPI Composite Index gained over 6%.
Key points:
- Bitcoin reached $81,687 on Wednesday, extending a rebound as bid liquidity thickened around $79,000 and $80,000..
- South Korea’s KOSPI Composite Index gained 6.63% as tech stocks rebounded from earlier October losses.
- Analysts remained uncertain about where BTC/USD will build its next trading range as resistance stayed intact near $82,000.
BTC price heads higher with KOSPI up 9.3% week-to-date
Data from TradingView showed BTC/USD extending an intraday rebound to reach $81,687 on Bitstamp.
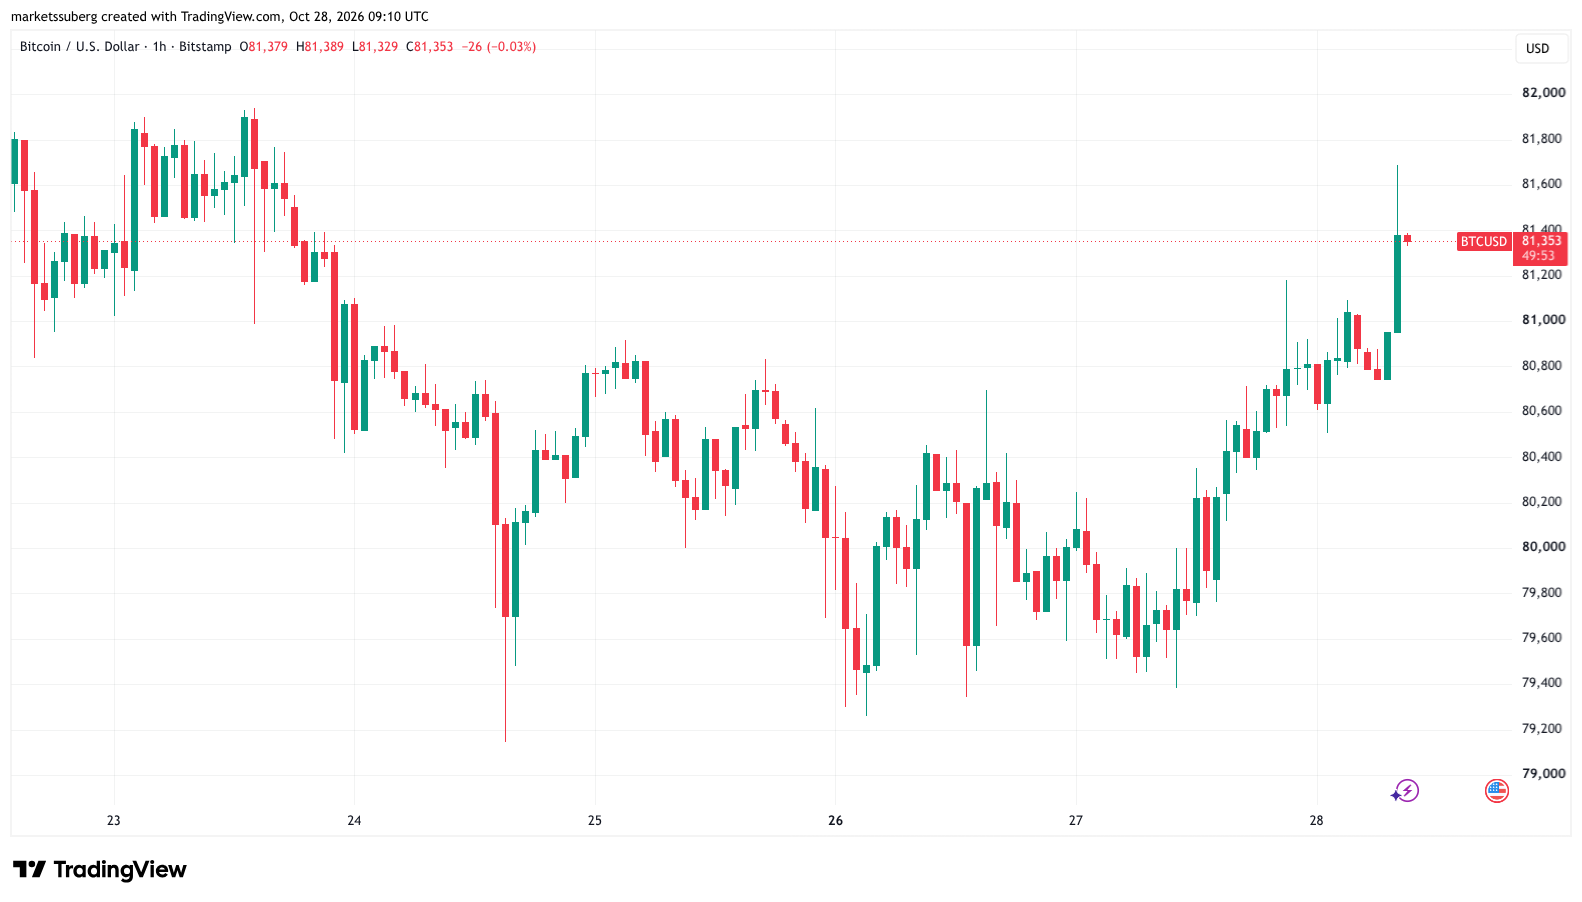
BTC/USD one-hour chart. Source: Cointelegraph/TradingView
The pair avoided new lower lows on hourly time frames as bid liquidity thickened around $79,000, and $80,000, per data from CoinGlass.
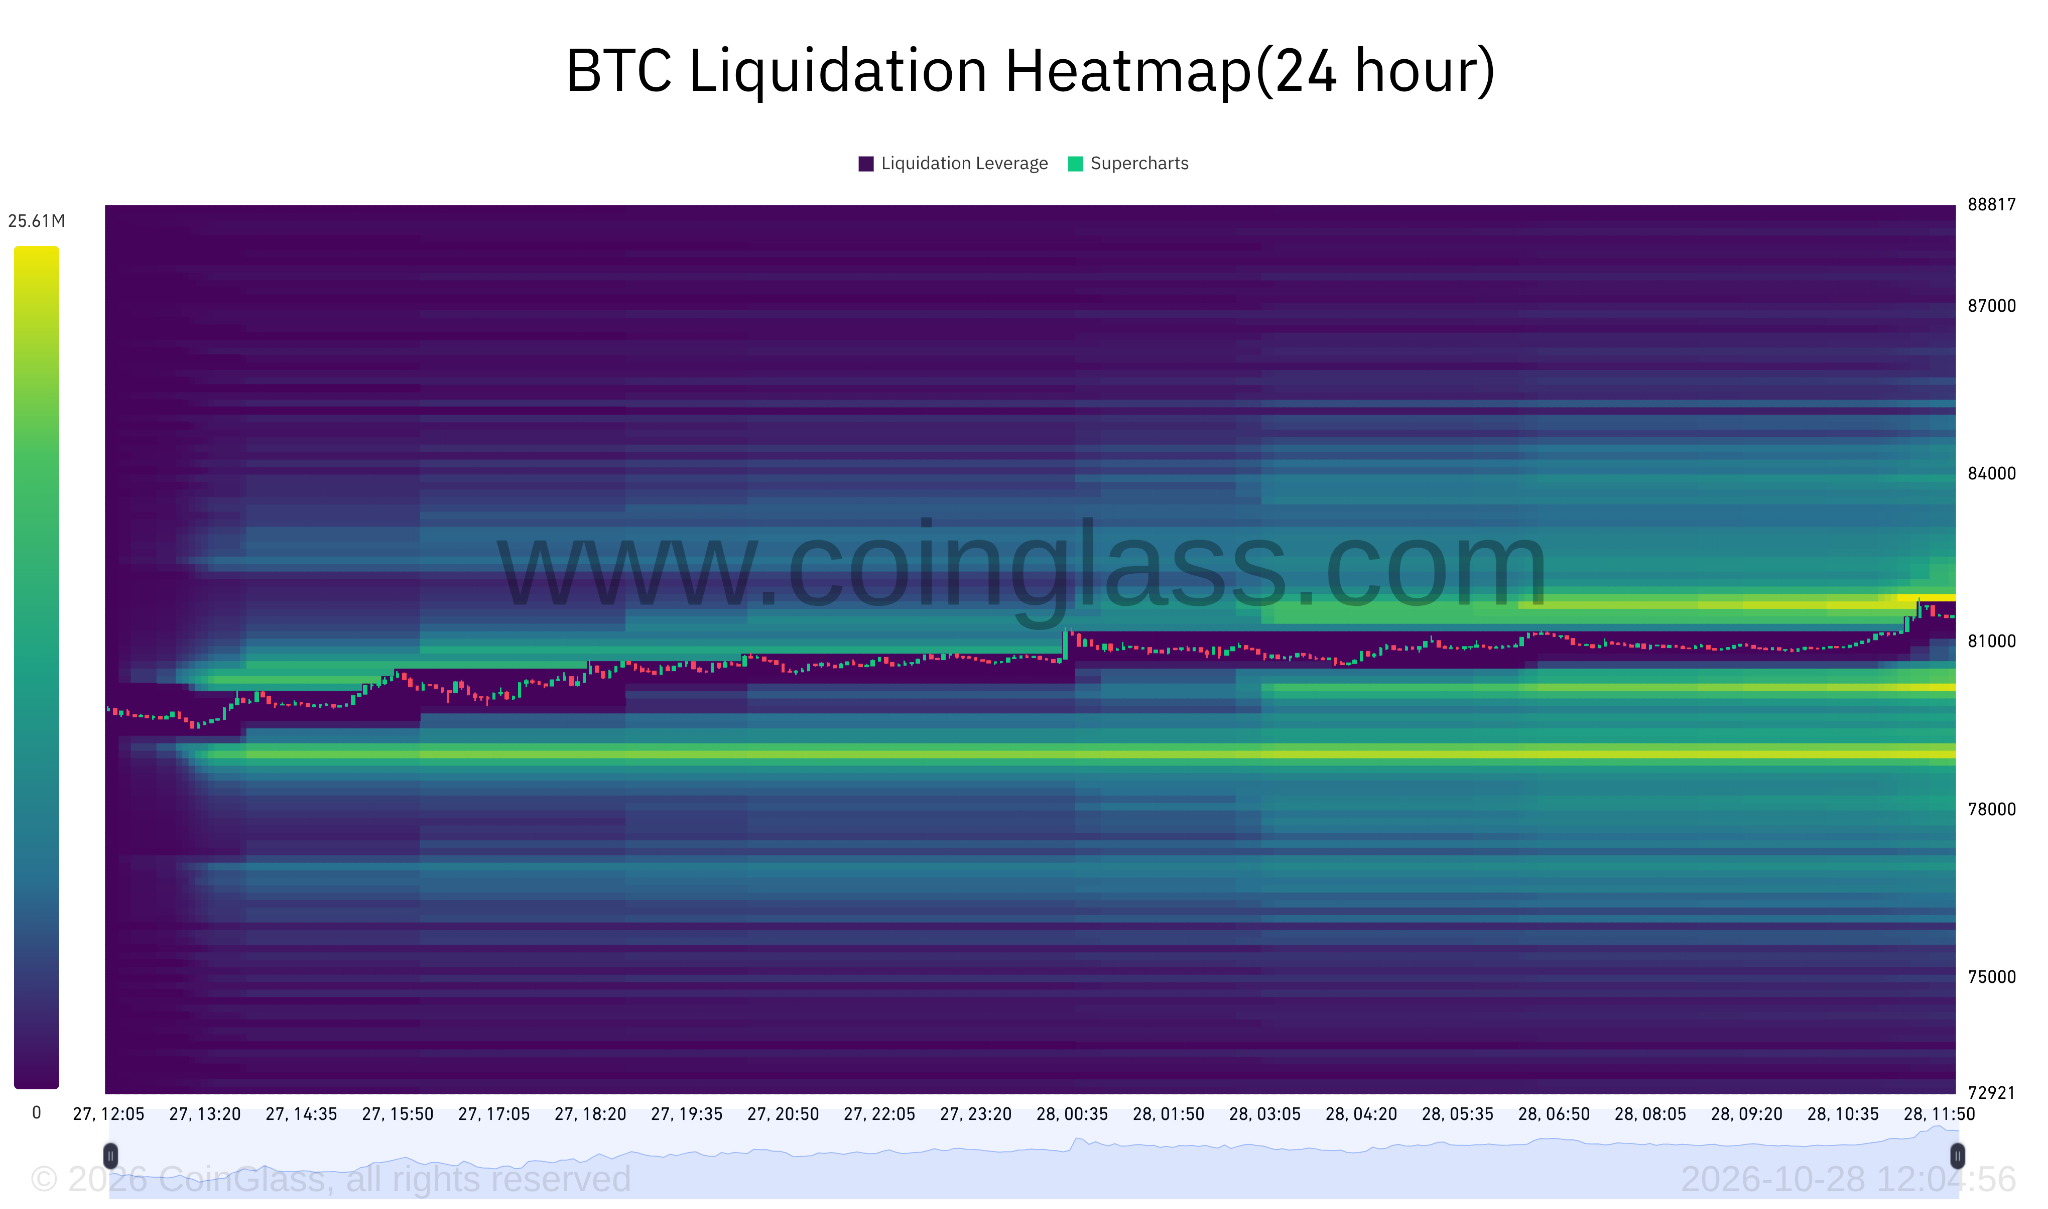
BTC liquidation heatmap. Source: CoinGlass
Crypto markets strengthened gradually as nerves over AI spending and debt financing eased. The KOSPI finished Wednesday’s trading session 6.6% higher, returning above 6,000 points for the first time since Oct. 14. The index’s week-to-date upside stood at 9.3%.
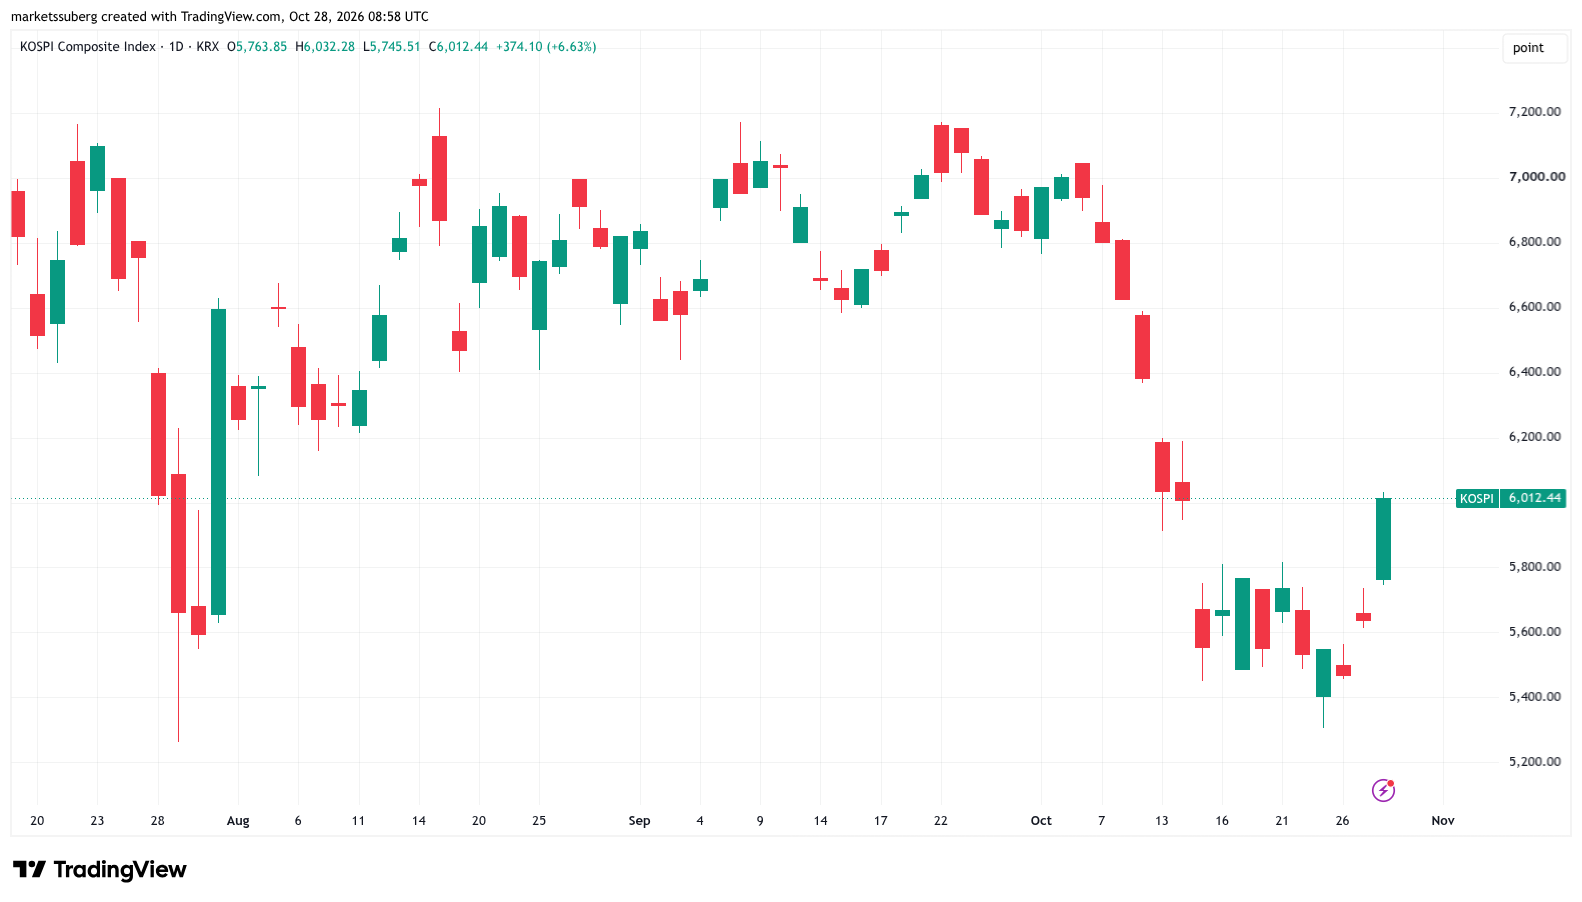
KOSPI one-day chart. Source: Cointelegraph/TradingView
In the US, the tech-heavy Nasdaq Composite Index closed up 1.1% on Tuesday ahead of major corporate earnings from Microsoft, Alphabet, Amazon and Intel. Samsung is due to report Q3 earnings on Thursday.
Speaking to CNBC, Mike Wilson, chief US equity strategist at Morgan Stanley, saw tech stocks entering a new bullish phase on the back of their rebound from a sell-off earlier in October.
“Most of the correction is already over. We’ve been in correction mode for four or five months… the market I think has digested this very efficiently,” he told the network on Tuesday.
Markets continued to expect the Fed to hold rates at its Wednesday meeting, with CME Group’s FedWatch showing 90.6% odds of rates staying in their current 3.75-4% range.
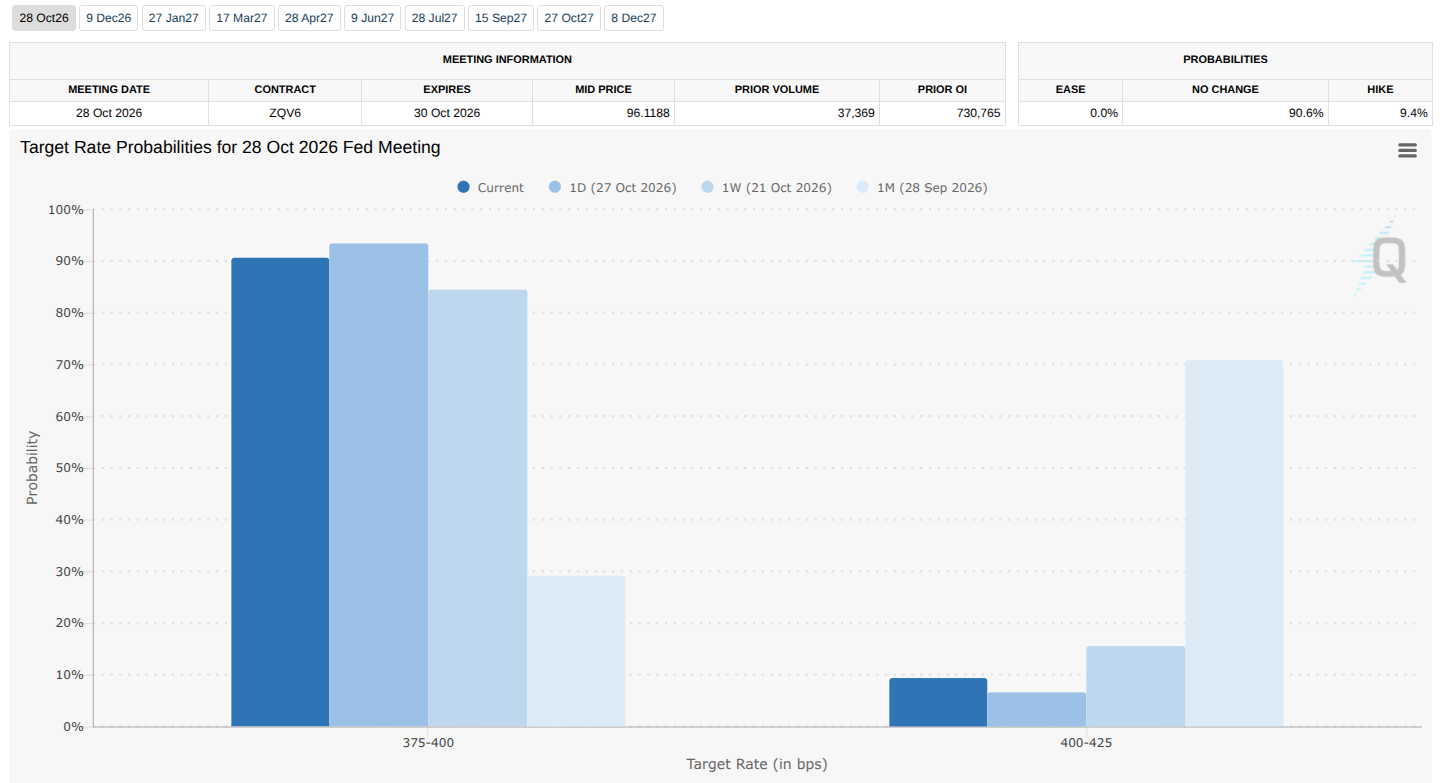
Fed target-rate probabilities comparison for October FOMC meeting (screenshot). Source: CME Group
BTC bear-market comparison puts focus on $82,000 resistance
Commenting on Bitcoin’s repeated dips below $80,000, crypto trader and analyst Rekt Capital drew fresh comparisons to the 2022 bear market.
Related: Bitcoin price analysis sees ‘strong rally’ as old coins become dormant
The weekly chart for BTC/USD resembles 2022’s structure, Rekt Capital said, with it still unclear whether the pair will build a new range above resistance around $82,000.
On weekly time frames, the pair has yet to discard a “macro accumulation range pattern” between $60,000 and $80,000, Rekt Capital added.
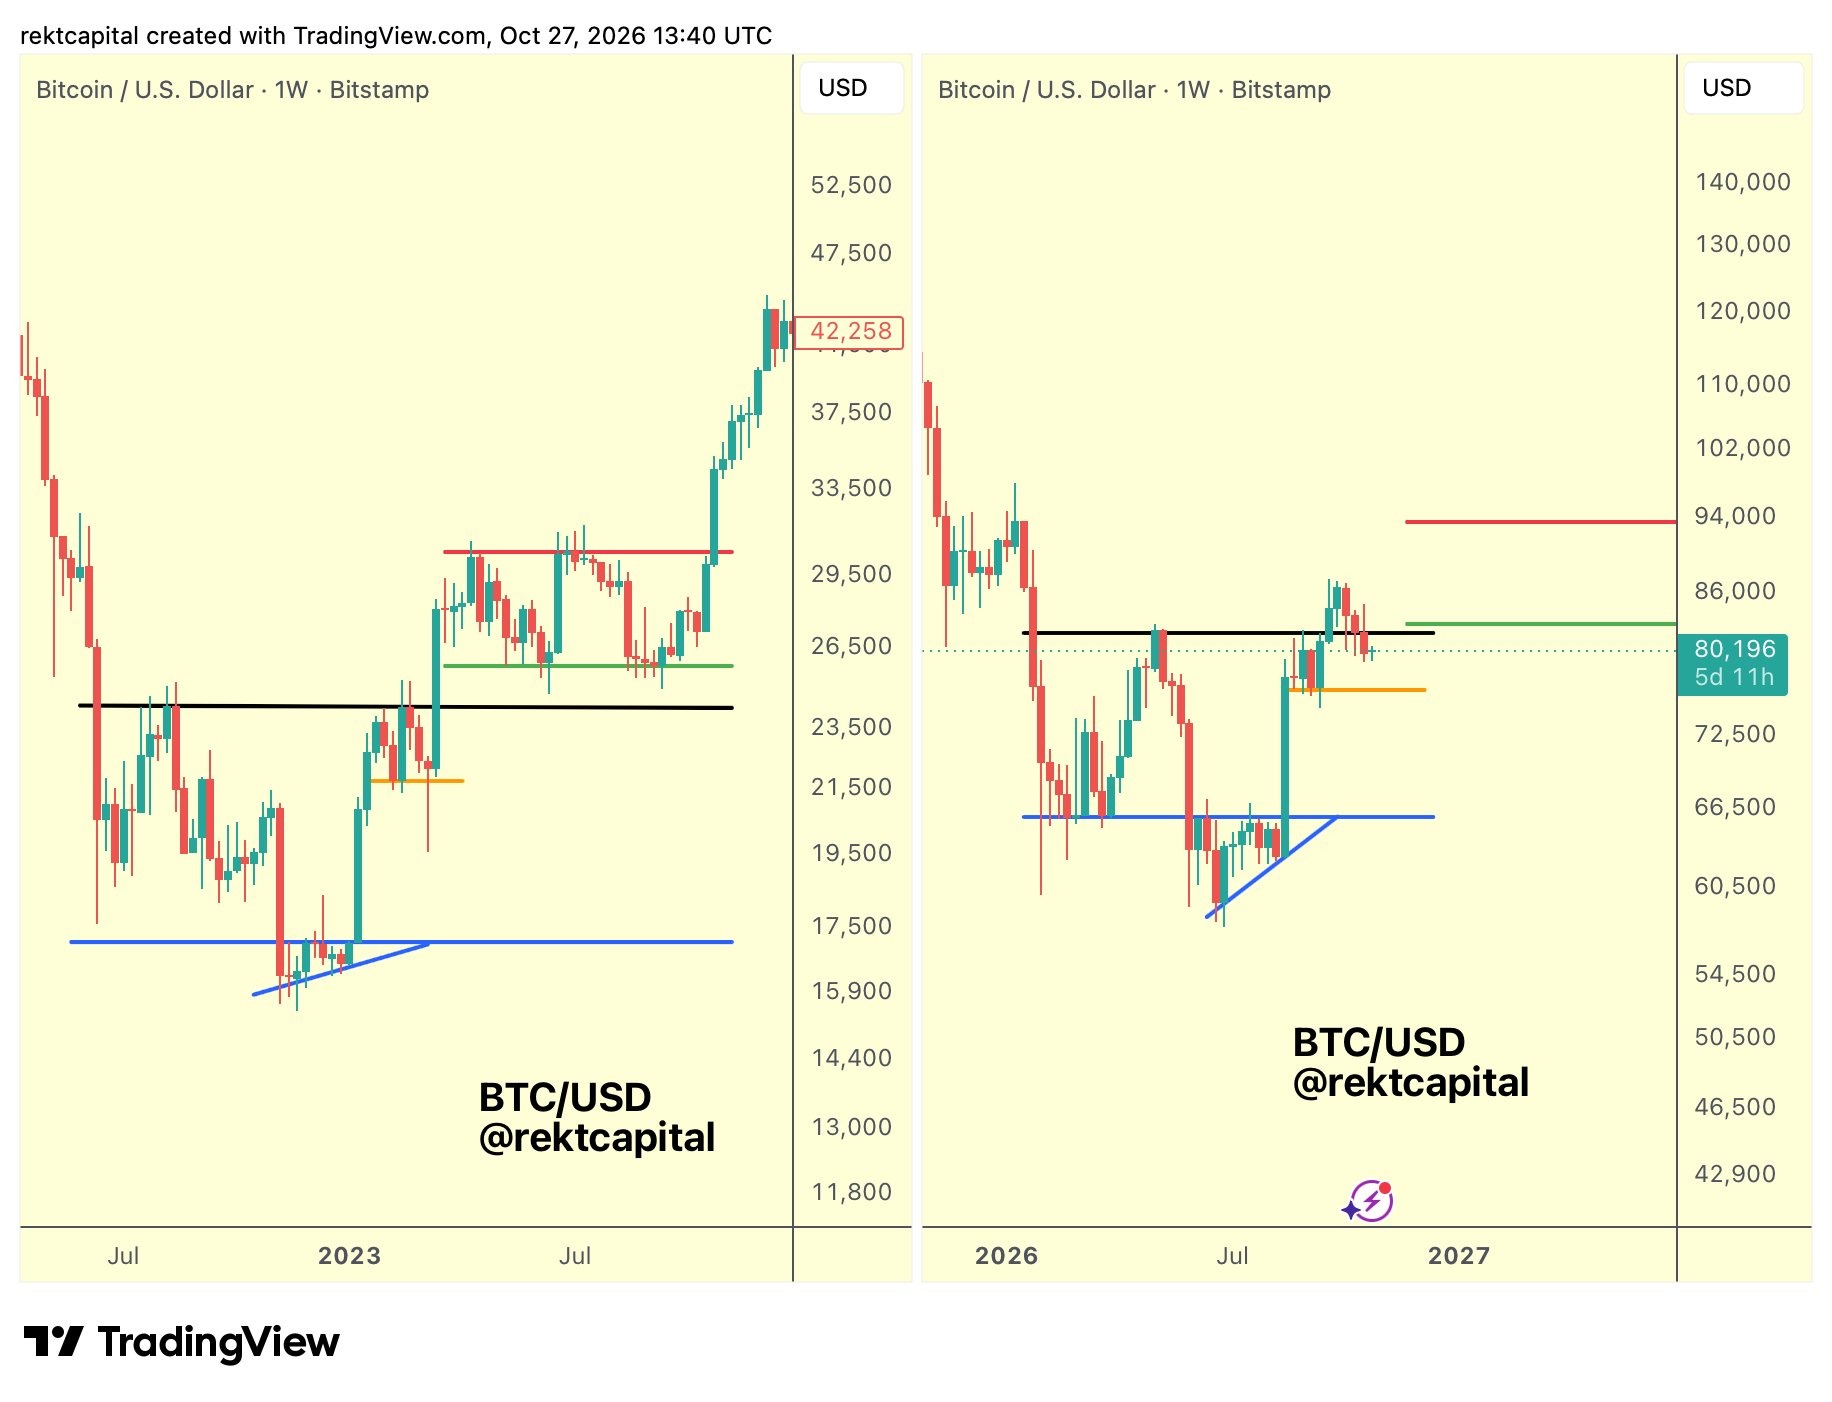
BTC/USD one-week chart comparison. Source: Rekt Capital on X.com
