


Bitcoin’s late-August recovery has unfolded in stages. Days prior to the Aug. 19 pump, VanEck’s capitulation dashboard showed broad market stress with eight of its 12 signals active, and the first move higher was consistent with a sharp reset in bearish positioning. The case for a more durable turn strengthened later as ETF creations and wallet accumulation broadened demand.
VanEck’s historical data distinguishes capitulation from timing. Comparable signal clusters trailed Bitcoin’s all-days baseline over the following 90 and 180 days, even though their one-year returns were stronger.
An Aug. 26 X post from The Bitcoin Historian offered the bullish shorthand: “12 out of 12.” The underlying report is more specific: eight signals were active on Aug. 12, while all 12 had entered extreme territory at some point during the preceding three months.
VanEck’s dashboard captured broad capitulation, while its return history shows that dense signal clusters were poor tools for timing Bitcoin over the next three or six months.
What the dashboard says about timing
Even the eight-signal count depends on a special rule. Eleven indicators use historical percentile extremes, while the price-drawdown signal fires when Bitcoin has fallen at least 35%.
VanEck measured the drawdown at 49%, but that decline ranked only in the 35th percentile of historical drawdowns. Applying the same percentile logic used by the other indicators would reduce the Aug. 12 count from eight to seven.
The more consequential warning comes from VanEck’s forward-return table. On observation days when eight to 12 signals were active, Bitcoin trailed its all-days baseline over both 90 and 180 days.
| Forward window | Eight to 12 signals active | Bitcoin baseline |
|---|---|---|
| 90 days | 12.8% | 15.2% |
| 180 days | 32.0% | 36.3% |
| One year | 166.2% | 96.0% |
The one-year return is stronger, but its statistical weight is easy to overstate. VanEck’s sample contains 115 heavily overlapping observation days drawn from a small number of distinct episodes, rather than 115 independent market bottoms.
Two one-year windows beginning one day apart share 364 of their 365 measurement days, or about 99.7%. That arithmetic illustrates the dependence between nearby observations; it does not assume that every row in VanEck’s sample was consecutive. VanEck does not publish an effective count of independent episodes.
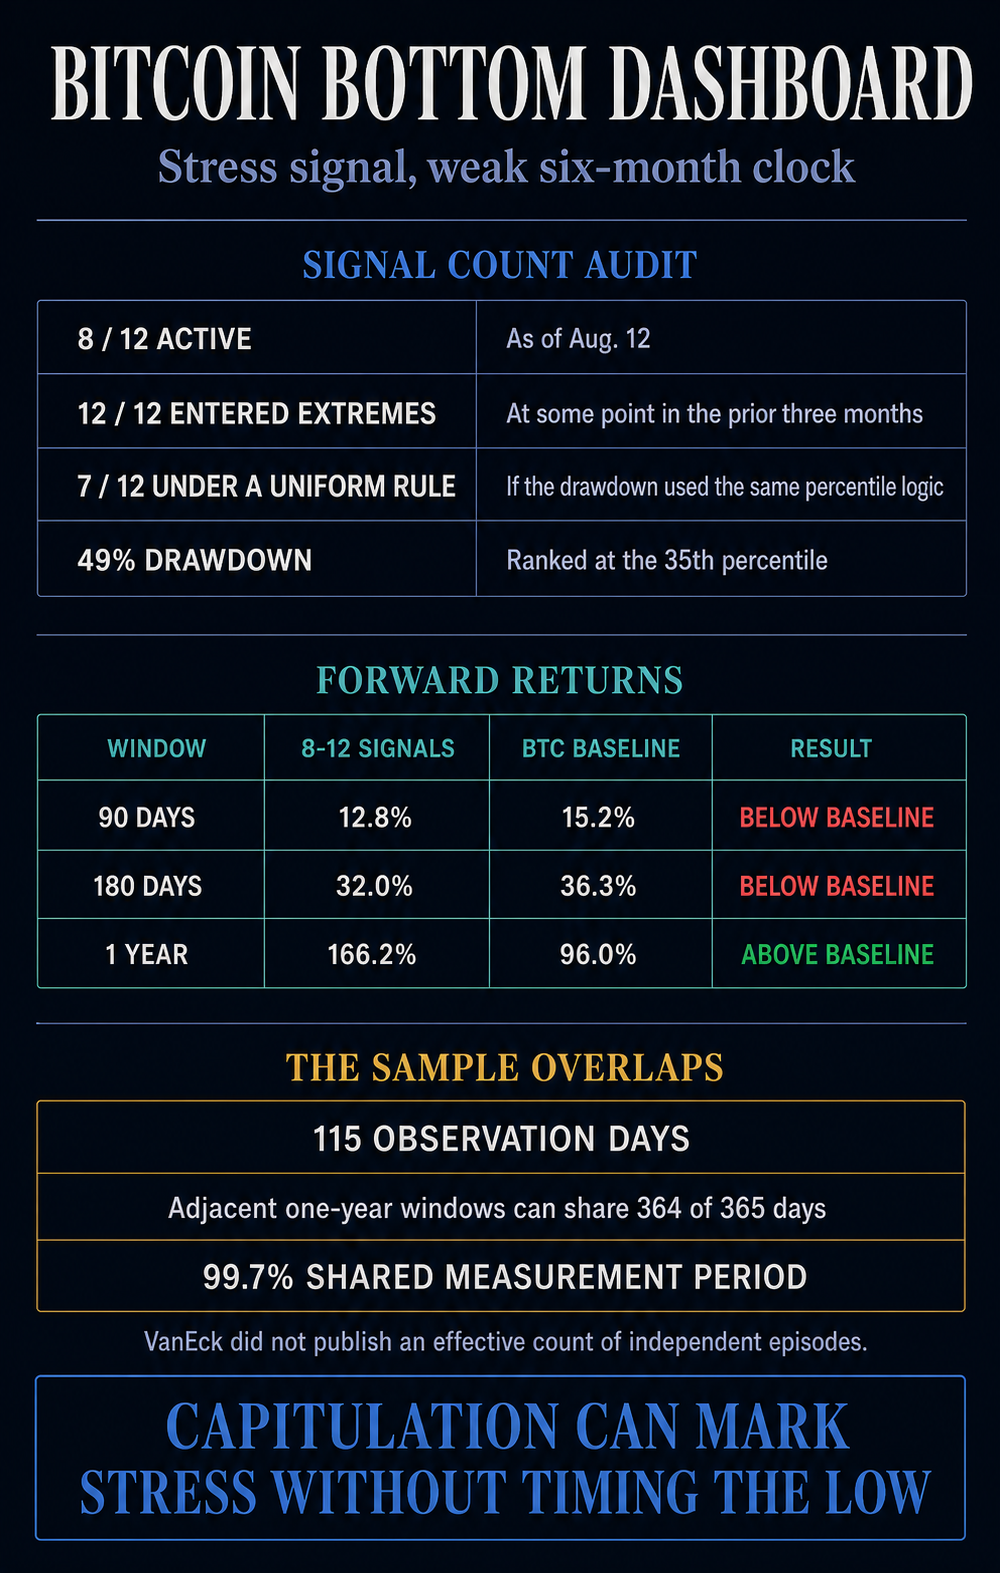
The history therefore supports a possible longer-term recovery after capitulation. It shows no excess return over Bitcoin’s baseline inside six months and does not establish that the dashboard identified the low.
The first leg of Bitcoin’s post-report rally was consistent with a positioning reset. Glassnode described Aug. 19 as the largest single-day Bitcoin short-liquidation event in its feed since 2019. Shorts represented 85% of liquidations across the squeeze window, futures open interest fell 11% in Bitcoin terms and funding stayed near neutral.
Shorts were forced out as leverage contracted, while the absence of an immediate funding spike argued against a leveraged long chase. That sequence explains how price could outrun a backward-looking capitulation snapshot without turning the dashboard into a reliable clock.
Later market data supplied the recovery case that the dashboard alone lacked. Glassnode recorded $2.23 billion of US spot Bitcoin ETF creations over seven days without an outflow day, alongside average daily ETF turnover of $2.4 billion. Farside’s daily flow table corroborated the positive direction of the visible sessions.
Glassnode also reported coins moving off exchanges and accumulation scores at or above neutral across all six wallet-size cohorts. Together, those observations show market participation broadening beyond the initial short-covering event, although they do not convert the earlier stress model into a timing signal.
Older coins were still moving as wallets accumulated
The later accumulation readings leave one on-chain warning unresolved. VanEck reported that supply held for more than one year fell by 356,534 BTC over 30 days to 11.84 million BTC, or 59.1% of circulating supply.
VanEck said the decline could reflect wallet churn or migration as well as distribution by older holders. Separating those possibilities required an age-band split of exchange inflows that the report did not yet provide.
Glassnode’s wallet-size accumulation score measures a different dimension. Small and large balance cohorts can accumulate while the share of coins held longer than one year falls, so the later cohort data do not prove that VanEck’s long-term-holder reading reversed.
The combined evidence ultimately points to a staged recovery: capitulation conditions were broad, the initial rally cleared bearish positioning, and ETF flows plus wallet accumulation later added support.
VanEck’s strongest signal clusters still lagged Bitcoin’s baseline inside six months, while the one-year advantage came from overlapping observations. The recovery case rests on what the market did after the snapshot, not on a definitive 12-signal bottom call.
